Halliburton eChartBook Mobile
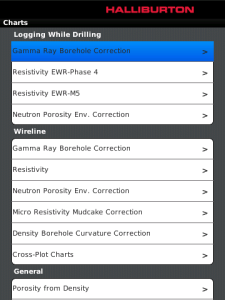
With eChartBook Mobile, customers have access to Halliburtons environmental correction algorithms wherever they are, without the need for a computer or an old-fashioned paper chart book.
Paper chart books were once the industry norm, but with an increasingly complex array of sensors available, such books become increasingly cumbersome and rapidly fall out of date. In addition, many of the charts in a paper chart-book are set up to represent specific environmental conditions, which may not exactly match the conditions in a real well. Users of paper chart books would have to estimate results or interpolate between different charts to obtain results for their particular circumstances. With the eChartBook, charts can be custom-built to reflect actual conditions, clearly showing results which are directly applicable to a specific situation.
The eChartBook interactive application includes environmental correction charts for all of Halliburtons major LWD and wireline sensors, such as gamma ray, resistivity, density and neutron porosity. The application also includes a number of useful general charts and tools for determining water saturation, borehole salinity, formation dip calculations and cross-plots, among others. Most charts in this application also incorporate single-point calculators, allowing customers to perform what-if calculations to see clearly how Halliburtons formation evaluation measurements are affected by the logging environment.
Benefits
Easy access to all current Halliburton correction charts from any location.
Generate customized charts appropriate for specific sets of environmental conditions.
Save charts as JPEG images for printing or inclusion in reports web version only.
Perform what-if style calculations to assess the impact of changes in the logging environment.
New in Version 1.2 : CrossPlot and General tool.

App Name:Halliburton eChartBook™ Mobile
App Version:1.0.0
App Size:1221 KB
Cost:FREE